 OTHERS
 Quantitative data vs Qualitative Data: What's The Difference?

Understanding the distinction between qualitative and quantitative data is fundamental to effective research, analysis, and decision-making across all fields. Whether you're conducting academic research, analyzing business performance, or making strategic decisions, knowing when and how to use each type of data can significantly impact the quality and reliability of your conclusions. This understanding enables researchers and professionals to choose the most appropriate methods for their specific objectives and ensures that data collection efforts yield meaningful, actionable insights.
What is Qualitative Data?
Qualitative data is descriptive, non-numeric information that focuses on exploring and understanding the deeper meaning behind phenomena. This type of data is inherently exploratory, designed to capture the richness of human experiences, perceptions, and behaviors. Rather than measuring quantities, qualitative data seeks to understand the "why" and "how" behind actions, decisions, and experiences.
The primary strength of qualitative data lies in its ability to provide context and meaning. It captures nuances, emotions, and complex relationships that numbers alone cannot convey. This data type is particularly valuable when researchers need to understand motivations, cultural contexts, or the subjective experiences of individuals or groups.
What is Quantitative Data?
Quantitative data consists of numeric, measurable, and objective information that can be counted, measured, or expressed mathematically. This type of data focuses on answering questions about "what" is happening and "how often" it occurs. Quantitative data provides concrete, statistical evidence that can be used to identify patterns, test hypotheses, and make predictions.
The objective nature of quantitative data makes it highly reliable for drawing generalizable conclusions. It allows researchers to establish relationships between variables, measure changes over time, and compare different groups or conditions with precision and statistical confidence.
What are the differences between qualitative vs. quantitative data?

Choosing the right data type is fundamental to research design, impacting how you collect data, formulate hypotheses, and conduct analysis. Here are the key distinctions:
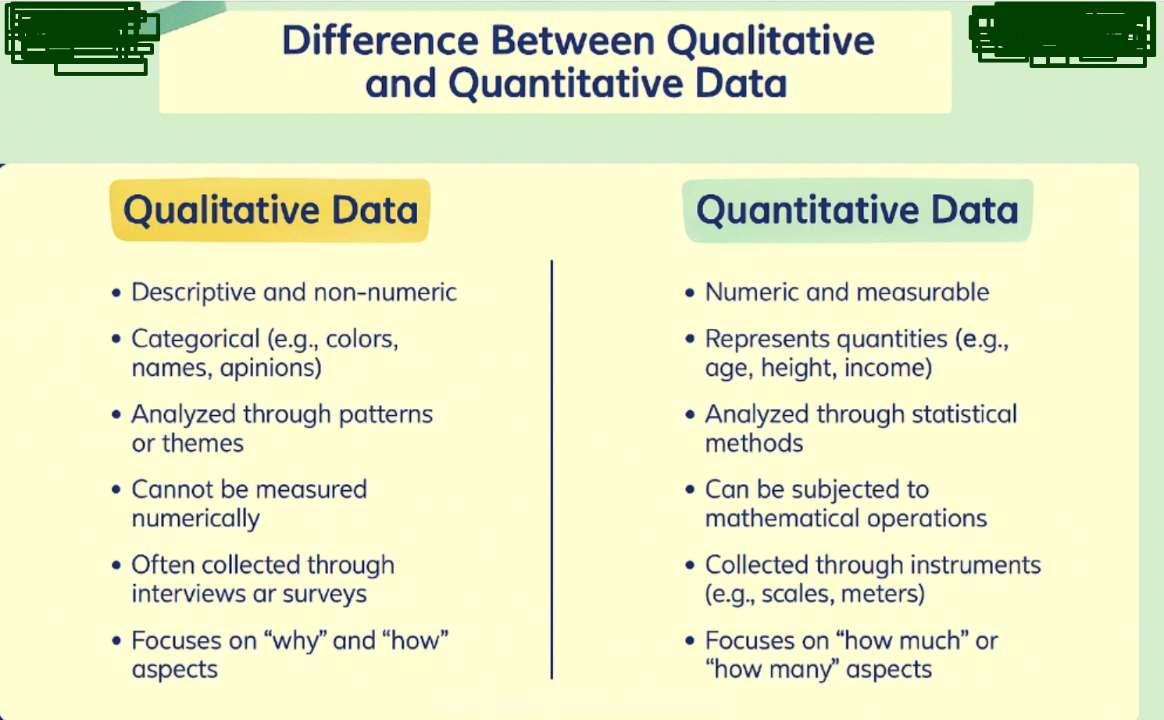
- Nature of the Data:
- Quantitative Data: Numerical, countable, or measurable.
- Qualitative Data: Interpretation-based, descriptive, and language-focused.
- Purpose & Insight:
- Quantitative Data: Answers questions like "how many?", "how much?", or "how often?" to quantify variables and relationships.
- Qualitative Data: Helps understand the "why?", "how?", or "what?" behind behaviors, experiences, and phenomena, providing depth and context.
- Characteristics:
- Quantitative Data: Typically fixed (predefined categories/measurements) and aims for universality (findings applicable beyond the specific sample).
- Qualitative Data: Inherently subjective (based on perspectives) and unique (capturing specific contexts and experiences).
- Primary Research Methods:
- Quantitative Research: Relies on measuring and counting (e.g., surveys, experiments, analytics).
- Qualitative Research: Employs interviewing and observing (e.g., interviews, focus groups, ethnography).
- Analysis Approach:
- Quantitative Data: Analyzed using statistical methods to identify patterns, relationships, and significance.
- Qualitative Data: Analyzed by identifying, grouping, and interpreting data into meaningful categories and themes.
Methods of Data Collection
Qualitative Data Collection
Interviews represent one of the most common and effective methods for collecting qualitative data. Through structured, semi-structured, or unstructured conversations, researchers can gather detailed insights into participants' thoughts, feelings, experiences, and perspectives. Interviews allow for deep exploration of topics and enable researchers to ask follow-up questions that reveal underlying motivations and meanings.
Observations involve systematically watching and recording behaviors, interactions, and phenomena in their natural settings. This method provides rich contextual information about how people actually behave, rather than how they say they behave. Observational data can reveal patterns and insights that participants themselves might not be conscious of or able to articulate.
Quantitative Data Collection
Surveys are structured questionnaires that collect standardized responses from large numbers of participants. They enable researchers to gather quantifiable data efficiently and can reach broad populations to ensure statistical representativeness.
Experiments involve controlled studies where researchers manipulate variables to observe their effects. This method allows for the establishment of cause-and-effect relationships and provides highly reliable quantitative evidence.
Polls are brief surveys that typically focus on specific questions or opinions, often used to gauge public sentiment or preferences on particular issues.
Digital analytics include modern data collection methods such as session replays and heatmaps. These tools automatically capture user behavior on websites and applications, providing quantitative insights into how people interact with digital interfaces.
Data Analysis Approaches
Qualitative Analysis
Qualitative analysis involves categorizing data into themes through systematic examination of textual, visual, or audio information. Researchers identify patterns, concepts, and relationships within the data to develop a comprehensive understanding of the phenomenon being studied.
The goal is generating deeper insights that reveal the underlying meanings, motivations, and contexts that drive behaviors and experiences. This process often involves iterative review and interpretation to ensure that the themes accurately represent the data and provide meaningful insights.
Quantitative Analysis
Quantitative analysis relies on statistical methods to examine numerical data. These methods range from basic descriptive statistics to complex inferential analyses that test hypotheses and establish relationships between variables.
The primary objective is identifying measurable patterns and trends that can be generalized to larger populations. Statistical analysis provides objective measures of significance, correlation, and causation that support evidence-based decision-making.
Examples of Each Data Type
Quantitative Data Examples
Number of attendees at events provides concrete metrics for measuring participation and engagement levels.
Revenue figures offer precise financial measurements that enable performance tracking and comparison across time periods or business units.
Rage clicks represent a digital analytics metric that counts instances of rapid, repeated clicking, indicating user frustration with interface elements.
Heatmap interactions quantify where users click, scroll, and focus their attention on web pages, providing measurable data about user behavior patterns.
Qualitative Data Examples
Contextual insights from descriptions and observations provide rich, detailed information about user experiences, motivations, and the circumstances surrounding particular behaviors. These insights help explain the story behind the numbers and reveal the human elements that quantitative data cannot capture.
Advantages and Disadvantages
Advantages of Quantitative Data
Quantitative data is quick and easy to collect, especially with modern digital tools and automated systems that can gather large amounts of information efficiently.
It offers clear interpretation through statistical analysis, providing objective measures that are less subject to individual bias or interpretation.
Results are replicable, meaning other researchers can follow the same methods and expect to achieve similar results, which strengthens the reliability and validity of findings.
Disadvantages of Quantitative Data
The primary limitation is limited context - numbers alone cannot explain the underlying reasons for behaviors or the circumstances that influence outcomes.
Quantitative data does not explain motivations, leaving researchers without insight into why particular patterns occur or what drives specific behaviors.
Advantages of Qualitative Data
Qualitative data provides rich, detailed insights that capture the complexity and nuance of human experiences and behaviors.
It helps understand reasons behind behaviors, revealing the motivations, emotions, and contextual factors that influence actions and decisions.
Disadvantages of Qualitative Data
Results are typically not statistically representative of larger populations due to smaller sample sizes and non-random sampling methods.
Qualitative research is time-consuming, requiring significant investment in data collection, transcription, and analysis.
There is potential for misleading conclusions due to researcher bias, participant bias, or misinterpretation of subjective information.
Bias in Data and How to Mitigate
Quantitative data can suffer from selection bias when the sample does not accurately represent the target population, leading to skewed results that cannot be generalized.
Qualitative data is susceptible to multiple forms of bias including researcher bias (when the researcher's preconceptions influence interpretation), participant bias (when participants alter their responses based on perceived expectations), and response bias (when participants provide socially desirable rather than truthful answers).
Mitigation techniques include careful sampling to ensure representativeness, triangulation (using multiple data sources or methods to verify findings), reflexivity (researchers examining their own potential biases), and transparency in reporting methods and limitations.
Using Both Together (Mixed Methods)
Qualitative and quantitative data complement each other by providing different perspectives on the same phenomena. Quantitative data reveals what is happening and how often, while qualitative data explains why it's happening and what it means to those involved.
A practical example is combining A/B testing and customer insights. A/B testing provides quantitative data about which version performs better statistically, while customer insights through interviews or observations explain why users prefer one version over another, revealing the underlying factors that drive the quantitative results.
Conclusion
Both qualitative and quantitative data types are valuable and serve essential roles in research and decision-making. Each offers unique strengths that address different aspects of understanding complex phenomena. The integration of both approaches provides a more complete understanding than either could achieve alone, enabling researchers and professionals to make more informed, evidence-based decisions that account for both measurable outcomes and human experiences.