WEB TESTING
 Load Testing Using ApacheBench (ab) on Kali Linux

In today’s post, I’m sharing how to perform load testing using the lightweight yet powerful tool ApacheBench (ab) on Kali Linux.
This is one of the simplest yet most effective ways to analyze your website’s performance, concurrency handling, and response time under different traffic levels.
Tools & Commands Used
Tool: ApacheBench (ab)
Platform: Kali Linux
Install ApacheBench on Kali Linux:
sudo apt updatesudo apt install apache2-utils -yab -n 100 -c 10 https://www.example.com/-n 100 → Total number of requests sent-c 10 → 10 concurrent users hitting the server simultaneouslyYou can also redirect your test output to a file for later analysis:
ab -n 10000 -c 1000 https://www.example.com/ > ab_report.txtRun a small load test to verify server connectivity and baseline stability:
ab -n 100 -c 5 https://www.example.com/Gradually increase concurrency to identify the server’s stability threshold:
ab -n 5000 -c 50 https://www.example.com/ab -n 5000 -c 100 https://www.example.com/ab -n 5000 -c 200 https://www.example.com/ab -n 10000 -c 1000 https://www.example.com/3. Soak Test
Run a long-duration test (30–60 minutes at concurrency level 200) to detect memory leaks or performance degradation over time.
Useful for simulating sustained traffic and identifying long-term stability issues.
4. Spike Test
Suddenly increase concurrency (e.g., from 100 to 1000 users) to evaluate how well the system handles traffic surges or flash events.
Why Use ApacheBench?
Lightweight and easy to use from CLI
Great for quick load and stress testing
Generates detailed performance metrics instantly
Test Environment
| Component | Details |
|---|---|
| Operating System | Kali Linux 2024.3 |
| Processor | Intel Core i7 |
| Memory | 16 GB RAM |
| Internet Connection | 100 Mbps Broadband |
| Protocol | HTTPS (TLSv1.3) |
| Monitoring Tools | top, vmstat, iostat, ss, Apache access/error logs |
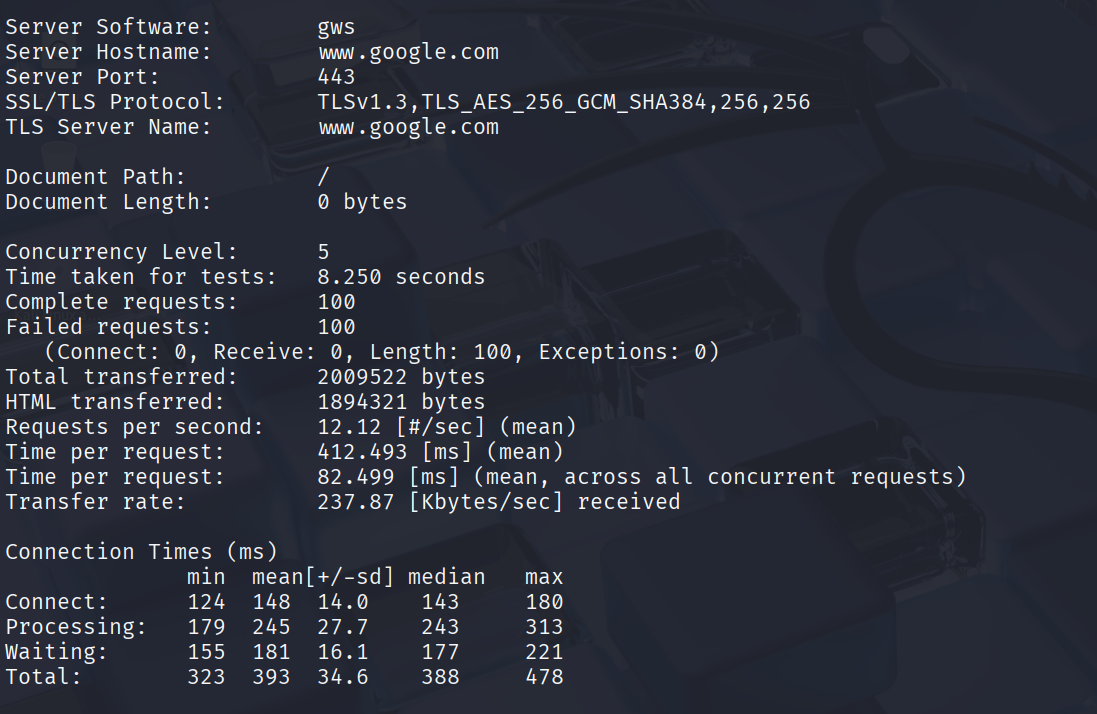
Final Test Summary
The load test was executed on the target server using ApacheBench (ab) from Kali Linux to evaluate overall system performance, scalability, and response behavior under concurrent traffic.
The testing covered multiple phases — smoke, ramp-up, soak, and spike — to simulate real-world conditions.
Key metrics analyzed include:
Total Requests Sent
Requests per Second (RPS)
Average & Maximum Response Time
Failed Requests Count
Total Data Transferred
Transfer Rate (KB/sec)
Connection Time (Connect, Processing, Waiting, Total)
ApacheBench may be small, but it’s powerful enough to reveal critical insights about your server’s performance.
By running progressive, soak, and spike tests — you can identify bottlenecks early and optimize before going live.
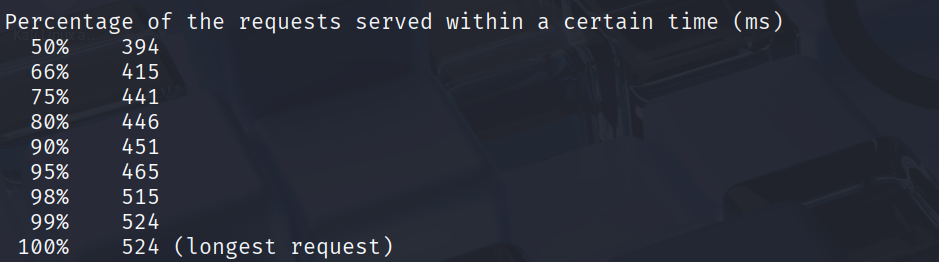
Sample Output